A frontline engagement score can look healthy while entire shifts remain unheard. Reliable measurement starts with reach, then tracks manager action and operational outcomes. Use mobile-first pulse listening, segment results by site, shift, and manager, and connect responses with absenteeism, turnover, safety, and service quality.
Annual surveys and a single company score rarely show what retail associates, nurses, production operators, drivers, or hospitality teams experience. Workers may not use a computer, share the same schedule, or report to the same manager each day. A short survey is only useful when you can see who received it, who accessed it, who responded, what supervisors did afterward, and whether conditions changed.
Frontline measurement belongs with workforce operations. Communication access, HR technology, manager behavior, employee feedback, and execution should be reviewed together. The broader frontline employee engagement perspective from Turn On Work also treats engagement as part of the employee experience rather than an isolated HR score.
Key takeaways
- Start with reach: Track delivery, access, response, and follow-through before interpreting sentiment.
- Use practical channels: SMS, QR codes, kiosks, and mobile tools generally suit shift work better than corporate email.
- Segment results: Compare site, shift, role, tenure, and manager results to expose issues hidden by enterprise averages.
- Connect sentiment to behavior: Review recognition, absence, turnover, safety, productivity, and service signals alongside pulse responses.
- Require manager action: Supervisors should discuss findings, assign actions, and show workers what changed.
Practical rule: A low response rate may signal a communication or access problem, not disengagement.
What Employee Engagement Means for Frontline and Deskless Workers
Employee engagement measurement is the repeated practice of checking whether people feel connected to their work, supported by their manager, equipped to perform, and willing to contribute beyond the minimum. For frontline and deskless teams, that check must include access to information, schedules, role clarity, tools, staffing, and the operational friction that shapes each shift.
Engagement and satisfaction measure different things. A satisfied employee may approve of a schedule or benefit. An engaged employee understands the work, trusts the person leading it, has reasonable support, and sees a reason to contribute. Sentiment reflects a person’s current view. Experience covers the conditions that shape that view across the employee lifecycle.
| Concept | What It Captures | Frontline Example | Measurement Signal |
|---|---|---|---|
| Engagement | Connection, commitment, and willingness to contribute | An associate recommends a better stock process and helps implement it | Engagement Index, eNPS, manager-support items |
| Satisfaction | Approval of a specific condition | A nurse is satisfied with the new scheduling process | Rating on schedule, pay, tools, or benefits |
| Experience | The full journey through work systems and interactions | A new operator receives training, a usable device, and clear shift instructions | Onboarding completion, task clarity, access, friction |
| Sentiment | Current mood or perception | A worker reports frustration after a missed schedule change | Pulse response, comment, mood check |
| Communication access | Whether people receive and understand essential information | A production worker sees a safety update before the next shift | Delivery, read, response, action completion |
The distinction matters because frontline work is shaped locally. A store associate may depend on a shift lead and mobile message rather than email. A healthcare worker may receive information during handoff. A manufacturing operator may judge the organization through equipment reliability, staffing, safety practices, and whether a supervisor responds to reported problems.
Office workers usually have steadier access to email, collaboration platforms, calendars, and senior leaders. Deskless workers may share devices, work across shifts, or have little time to complete a survey. Deskless employee engagement therefore includes a reach question: did the organization make participation possible for the people it intended to hear from?
Gallup reports that 70% of the variance in team engagement is determined by the manager, and its Q12 framework supports frequent conversations that can drive change. Its analysis also reports engagement of 26% among frontline workers in the United States, compared with 32% for the overall workforce. These figures support a practical measurement rule: compare frontline teams with comparable frontline teams rather than a blended company average. Gallup analysis of frontline supervisors and engagement
A useful Turn On Work approach segments results by site, shift, and manager before leaders interpret an overall score. That view can expose a location with weak communication reach, a shift with recurring operational friction, or a manager whose team receives feedback but sees little follow-through. It connects engagement to workforce experience, where communication, tools, manager habits, and operating conditions are reviewed together.
What to Measure Beyond the Engagement Score
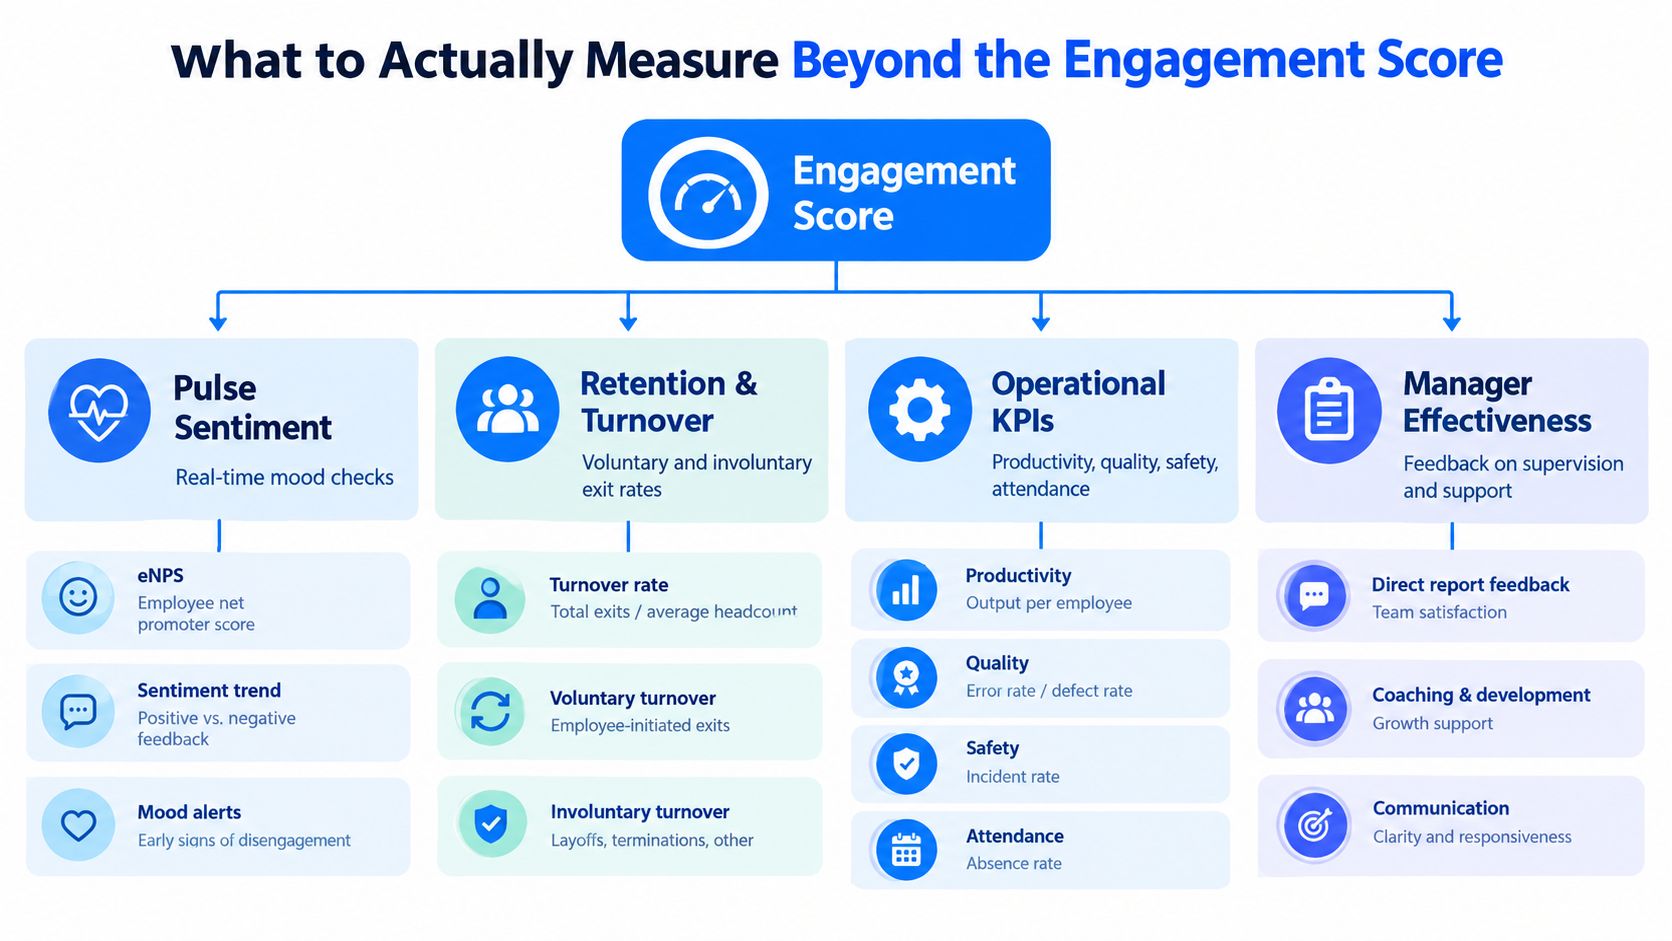
A frontline engagement score is an outcome, not a diagnosis. Measurement needs to show four things: who could participate, what employees experienced, how managers responded, and whether working conditions changed. That requires a layered view of sentiment, reach, manager action, and operational outcomes.
Make “mobile-first employee engagement platform” the anchor text and link it to HubEngage’s employee-feedback page. HubEngage specifically positions its feedback solution around pulse surveys, AI analytics, SMS, mobile apps, and frontline/deskless workers, so the topical relevance is strong.
A practical measurement set includes:
- Engagement Index: Use consistent 5-point Likert items covering manager relationship, role clarity, growth opportunity, peer connection, organizational alignment, and workload sustainability. A practical benchmark recommends a 10 to 15 item index that remains short enough for frontline use. HRBench’s engagement index guidance recommends treating response rates above 70% as more reliable, while results below 50% should remain directional.
- eNPS and sentiment: eNPS asks whether employees would recommend the organization as a place to work. Track its direction over time, then pair it with comments or focused questions that clarify the reasons behind movement.
- Participation quality: Track invitation delivery, message exposure, read or open activity, response, completion, comments, and action completion. A low score means something different when half the intended workforce never received or could not access the survey.
- Manager behavior: Measure recognition frequency, follow-through on reported issues, team conversation quality, coaching access, and whether managers communicate decisions back to workers. These measures connect sentiment with behavior leaders can change.
- Operational indicators: Pair engagement analytics with absenteeism, turnover, safety reporting, productivity, service quality, schedule adherence, training progress, and technology adoption where those measures are available.
Channel choice affects participation quality. Independent benchmarks cited in 2026 report that frontline pulse surveys may achieve 20% to 45% response through an unsuitable channel, compared with 60% to 80% through SMS and 40% to 60% through paper surveys. Email surveys for frontline teams are commonly reported at 15% to 30%. CrewCheck’s frontline pulse survey guidance presents these figures as directional context, not a universal target. A channel that workers cannot use during a shift will distort the result before analysis begins.
What not to average together
Do not combine every worker, location, shift, and tenure group into one employee engagement score. A company average can remain stable while an overnight shift struggles with staffing, a clinic has weak manager follow-through, or a factory lacks reliable communication access.
A useful dashboard should allow leaders to filter by:
- Site and location: Find local friction and compare similar operating environments.
- Shift: Separate day, evening, overnight, weekend, and rotating schedules.
- Role: Distinguish supervisors, associates, clinicians, operators, drivers, and support roles.
- Tenure: Identify onboarding issues and later-stage retention risks.
- Manager: Connect team sentiment with follow-through and leadership behavior.
The employee experience intelligence perspective from Turn On Work supports this segmentation by site, shift, and manager. Participation metrics are operational evidence, not administrative details. They can show whether a low score reflects genuine disengagement, inaccessible technology, poor message distribution, survey distrust, or a manager who fails to close the feedback loop. Repeated comparisons then help leaders assign action to the right site or manager instead of applying a company-wide fix.
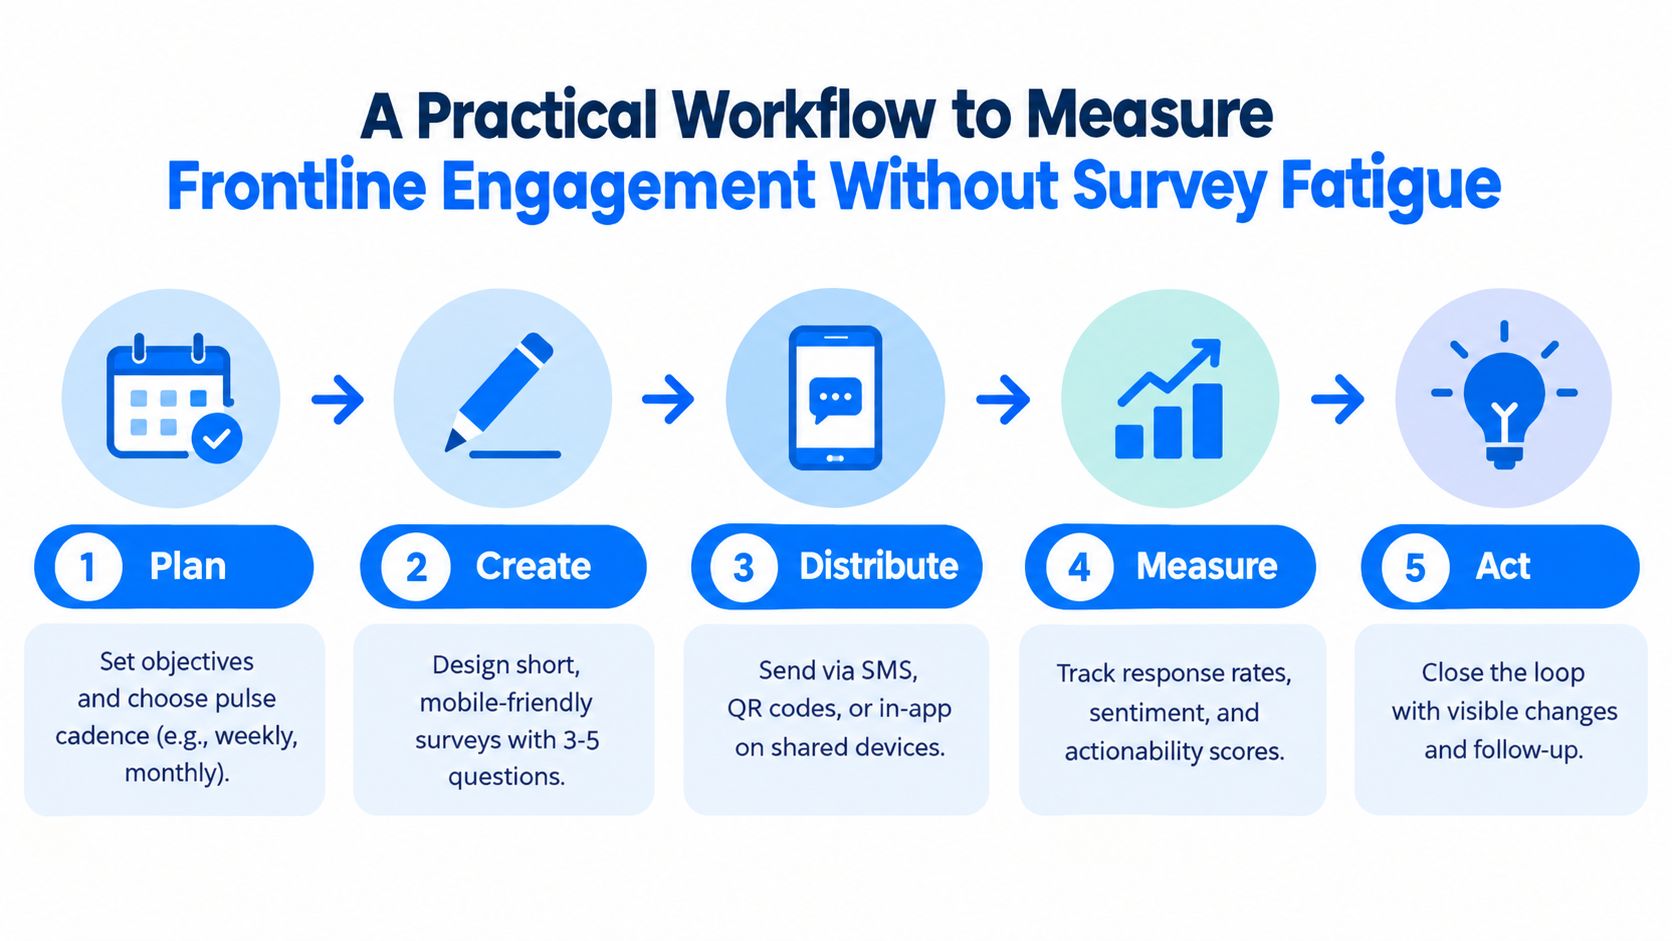
A Practical Workflow to Measure Frontline Engagement Without Survey Fatigue
A survey score is only useful when workers can respond, managers act, and operating conditions change. The most dependable workflow is short, mobile-first, segmented, and connected to visible follow-through. It must work across retail regions, healthcare networks, manufacturing groups, and other distributed operations where access, shifts, and manager routines differ.
1. Define the decision before writing questions
Start with the operational decision the measurement should support. You may need to understand rising absence at a site, whether a scheduling tool is usable, why a shift is missing updates, or whether supervisors are responding to workload concerns.
Choose a limited set of themes. A practical frontline employee survey can cover manager support, role clarity, workload, communication access, recognition, safety, development, and intent to stay. Do not add items because a stakeholder requests them. Each question should support a decision, a conversation, or a follow-up action.
Create a baseline before changing the program. Record the current response, score, and operating context by site, shift, role, and tenure. If leaders cannot explain who was included, the average has limited value.
2. Build a short instrument workers can finish on the job
Use a mobile-first employee engagement survey that takes under 2 minutes to complete. A longer annual questionnaire can support broader planning, but it should not be the only feedback channel for frontline workers.
For a formal Engagement Index, use 10 to 15 questions on a 5-point Likert scale. Cover manager relationships, role clarity, growth opportunity, peer connection, organizational alignment, and workload sustainability. Keep pulse surveys lighter when listening frequently. One or two core trend questions, one operational question, and one open comment prompt can provide a workable signal.
Translate questions into the languages workers use and test them with employees before launch. Wording that seems clear to HR can be ambiguous on a production floor or during a clinical handoff. Avoid double-barreled questions, such as asking whether a manager is both supportive and fair.
3. Match distribution to the work
Choose SMS, QR codes, kiosks, shared tablets, or an existing frontline app according to workforce access and privacy requirements. Email can serve employees who use it regularly, but it should not be the default for workers without dependable inbox access.
GoHappyHub’s guidance on measuring employee engagement reports that SMS surveys can achieve a 98% open rate and are typically read within 3 minutes. Treat those figures as a cited channel benchmark, not a guarantee for your workforce. Test delivery by site and shift, then monitor whether messages arrive when employees can reasonably respond.
Timing affects participation. Avoid sending every survey during a handoff, peak customer period, medication round, or production changeover. If workers share devices, provide a private alternative and explain how responses are protected.
4. Calculate the score, then inspect the distribution
Calculate an Engagement Index by averaging selected Likert responses after defining how missing answers are handled. Keep wording and scoring stable enough to identify trends. Report the distribution, not only the mean.
A practical reporting view can include:
- Overall index and trend
- Response rate by site and shift
- Lowest-scoring items
- Comment themes
- Manager follow-through status
- Related absence, turnover, safety, or service indicators
A score without reach data can mislead. Do not compare teams with very different response coverage as though they provide equal evidence. A high score from a small, self-selected group may be less useful than a moderate score supported by broad participation.
5. Segment before diagnosing
Break results down by location, role, tenure, shift, and manager. Set a minimum reporting threshold that fits organizational policy and local requirements. Small groups should never be used to identify individuals or punish workers for criticism.
Use a segmentation model that examines reach, response, manager action, and operational outcomes. Site, shift, and manager cuts can expose hidden disengagement that a company average conceals. A low score may reflect genuine disengagement, inaccessible technology, weak message distribution, distrust of surveys, or a manager who does not close the feedback loop.
Look for repeated patterns rather than isolated noise. If several shifts at one site report poor communication access, improve distribution and handoff practices before launching another survey. If one manager’s team reports low recognition and follow-through while nearby teams do not, focus the intervention on that manager’s routines.
6. Close the loop within 30 days
Employees do not need every request approved. They do need a clear response. Managers should share what they heard, what they can change, what requires escalation, and when workers will receive an update.
Yourco’s guidance on frontline communication measurement recommends tracking delivery, read or open activity, response, and follow-through by shift or site, then closing the loop within 30 days. Its cited findings also report that only 43% of frontline employees consistently receive company communications and 36% read them, while 65% of frontline leaders believe communication is effective compared with 35% of workers who feel heard. The gap makes manager communication a measurement variable, not merely a cultural aspiration.
Set a recurring operating rhythm. Review urgent signals weekly, inspect the fuller dashboard at least monthly, and revisit survey design when response quality declines. The employee engagement pulse survey guidance from Turn On Work provides relevant guidance on mobile access, role-based analysis, multilingual communication, and frontline context.
Connecting Engagement Metrics to Operations Manager Action and Business Outcomes
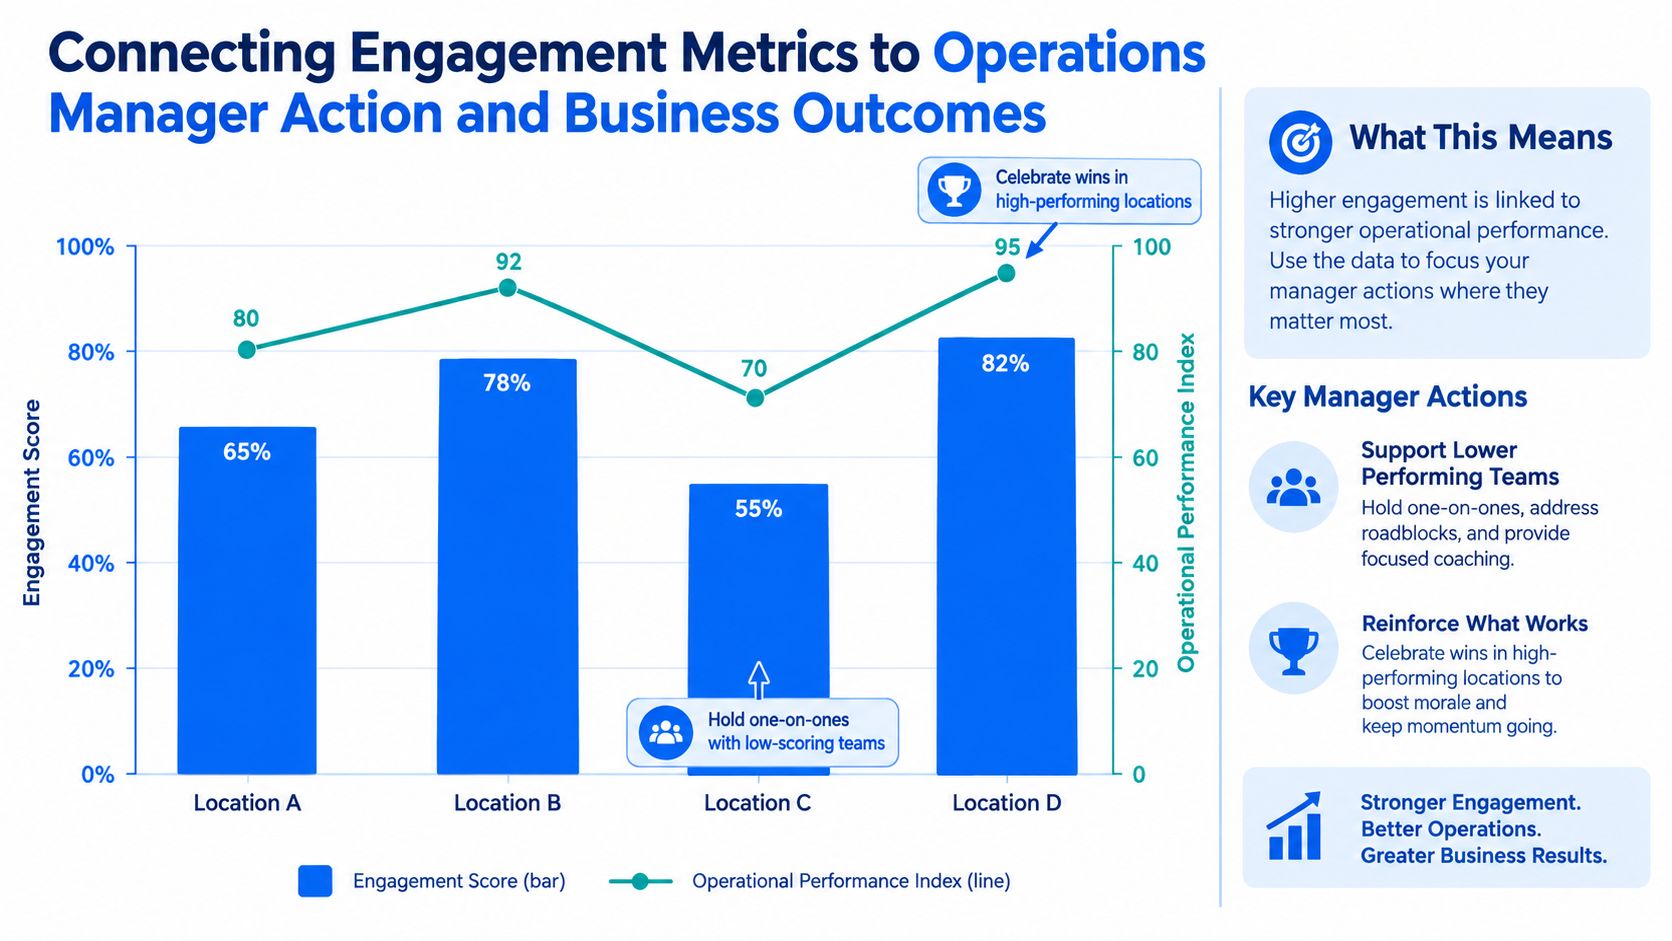
Engagement data becomes valuable when it identifies a manager action that can change an operating condition. A score can tell you where to look. It can’t, by itself, tell you whether the problem is staffing, communication, training, equipment, scheduling, recognition, or supervision.
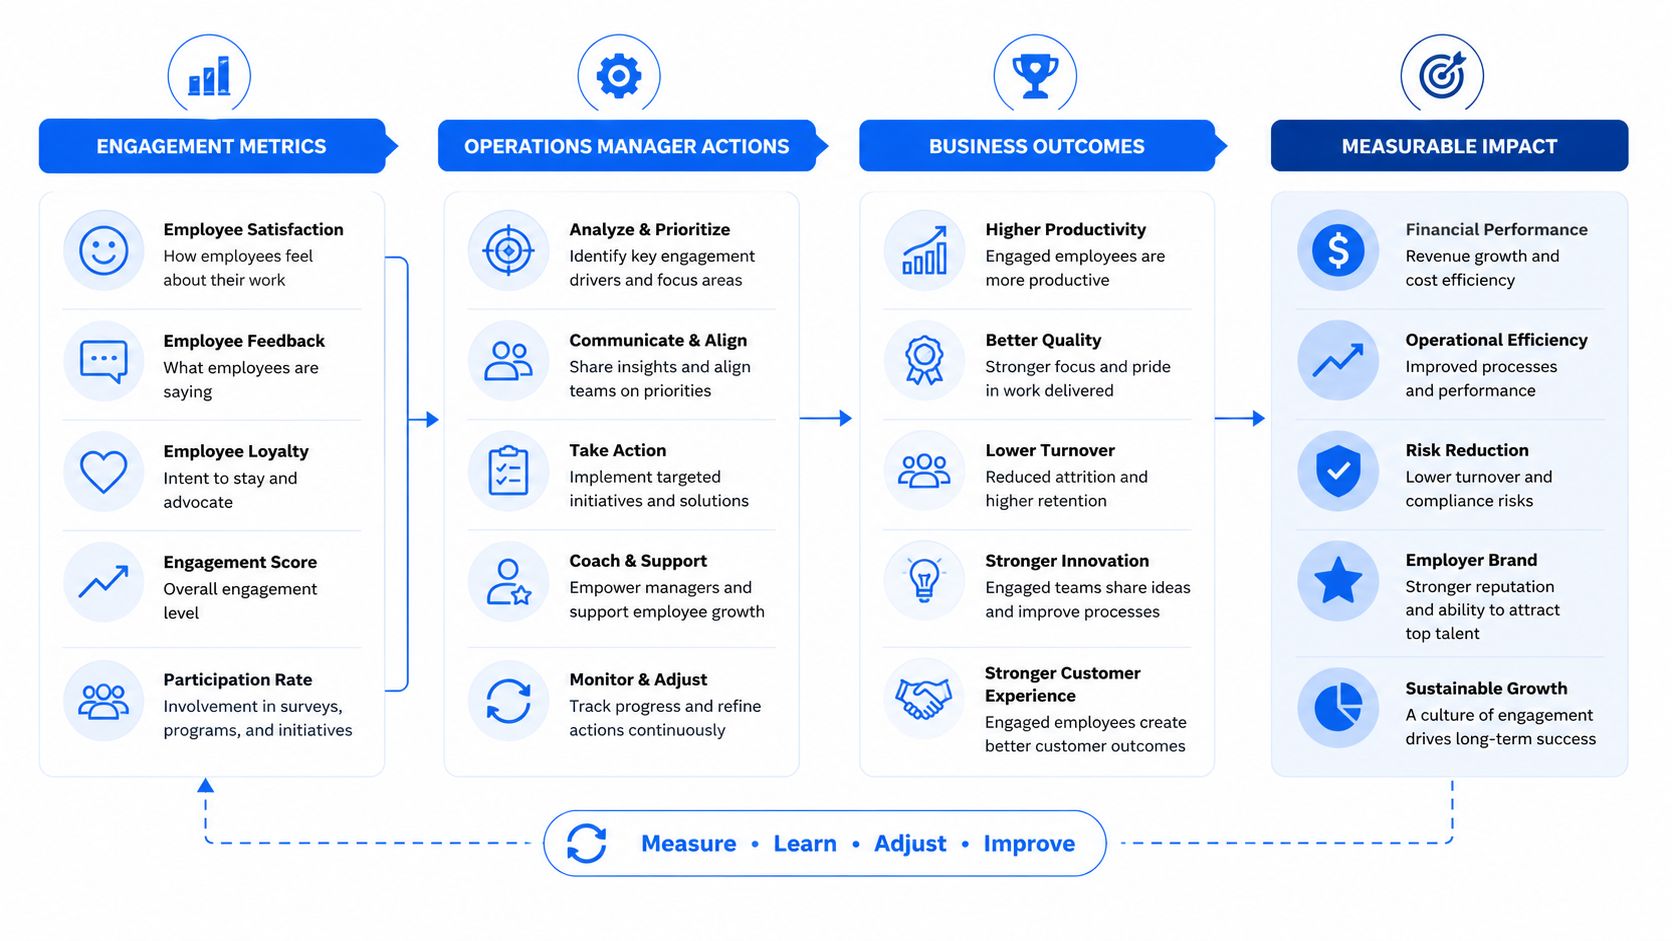
The TurnOnWork framework below is an editorial model, not an established industry standard. It organizes frontline engagement measurement into four layers:
- Reach: Did the worker receive and access the message or survey?
- Response: Did the worker participate, comment, or report a problem?
- Manager action: Did the supervisor discuss the result and complete a committed action?
- Operational outcome: Did the relevant condition move, such as absence, turnover, safety reporting, service quality, productivity, or schedule stability?
Use a decision matrix instead of a leaderboard
A low score doesn’t always mean the same thing. Use the combination of reach, sentiment, manager behavior, and operations to decide what happens next.
| Pattern | Likely interpretation | First action |
|---|---|---|
| Low reach, unknown sentiment | Communication or access failure | Check phone records, QR placement, device access, language, and shift timing |
| High reach, low sentiment, weak follow-through | Workers are speaking but managers aren’t responding | Coach the manager, assign an action owner, and publish an update date |
| High reach, low sentiment, rising absence | Engagement concern may reflect workload or staffing friction | Review schedules, coverage, workload, and local operating constraints |
| Good sentiment, poor safety or service outcomes | Positive feeling is not translating into execution | Audit training, workflow design, equipment, and quality controls |
| Strong sentiment and strong outcomes | Local practice may be working | Document the manager routine and test whether it transfers elsewhere |
This approach prevents leaders from blaming employees for low participation or celebrating a high score without checking whether work is functioning. It also separates commitment, trust, and operational friction, which can move in different directions.
Connect manager behavior to the right outcome
Manager follow-through should be specific enough to audit. “Improve communication” isn’t an action. “Review the next schedule change during shift huddles, post it through the approved mobile channel, and confirm receipt” is observable.
Track the behavior alongside the outcome it should influence:
- Recognition frequency with sentiment, retention, and team comments.
- Coaching and one-to-one completion with role clarity, growth perception, and performance trends.
- Schedule communication with read rates, shift coverage, absence, and last-minute changes.
- Safety conversations and issue resolution with safety reporting and incident patterns.
- Training completion and task confidence with time to productivity, quality, and service measures.
- Manager commitments completed with the next pulse response and comment themes.
Operational guidance recommends combining pulse sentiment with recognition, manager follow-through, absenteeism, safety incidents, turnover, productivity, and service quality. Another frontline engagement analysis from Turn On Work describes the value of separating engagement from belonging and retention risk, because workers can report positive engagement while still feeling expendable.
Let AI find patterns, not make personnel judgments
AI can help classify open comments, detect recurring themes, identify unusual differences between shifts, and summarize changes across a large network. It can reduce manual sorting, but it shouldn’t decide that a manager is ineffective or that an individual employee is disengaged.
Human leaders still need to validate context. A comment about workload may reflect a temporary absence, a broken process, a seasonal peak, or a chronic staffing problem. Set access controls, explain how comments are used, and keep individual-level decisions out of automated scoring unless governance, consent, and applicable legal review support that use.
The workforce operations perspective from Turn On Work fits this model because engagement improvements depend on execution. A dashboard should lead to a manager conversation, a process change, a communication fix, or a documented decision. Turn On Work is one possible publication and resource for this combined workforce experience and operations perspective, alongside employee listening and workforce management platforms.
FAQs on How to Measure Employee Engagement Frontline
How often should companies run a frontline employee survey?
Match listening frequency to the decision you need to make. Use short pulses when leaders can review results and act, then monitor communication and operational signals weekly or monthly. A survey that produces no visible response will reduce participation over time.
What is a good frontline employee engagement score?
There is no universal target across industries, sites, or shifts. Set a baseline, compare similar groups, and read the score beside coverage, comments, manager follow-through, absence, turnover, safety, quality, and service outcomes. Gallup’s frontline findings show why a blended workforce benchmark can hide local problems. Gallup’s frontline engagement data supports comparing like with like.
Add a simple segmentation view by site, shift, and manager. A stable overall score can conceal one poorly reached shift or a manager whose team receives no follow-up.
What response rate should a deskless employee survey target?
Treat response rate as a reach measure, not a pass or fail grade. Check delivery, access, language, device availability, and completion by site and shift before interpreting the result. A low response from one shift may indicate a scheduling or channel problem rather than low engagement.
Use the HRBench’s engagement index resource as a reference point, then set an internal target based on how workers receive surveys. Report unanswered groups alongside the score so leaders can see whose experience is missing.
Which tools support frontline employee listening?
Choose channels that fit the work, such as SMS, QR codes, kiosks, shared devices, mobile apps, or manager-led conversations. The system should segment by site, shift, role, and tenure, protect confidentiality, show who was reached, and record follow-up actions. A survey-only platform leaves the operating problem unresolved.
What are the most common mistakes in 2026?
Common failures include relying on corporate email, writing long surveys, averaging away site differences, treating eNPS as the whole picture, and collecting feedback without reporting what changed. Avoid using AI to label individuals. Use it to group themes, then let managers validate context and choose accountable actions.
Build each cycle around the next operational decision. Start with one representative facility or region, publish an action update within 30 days, and expand after workers can see that feedback changes how work gets done.