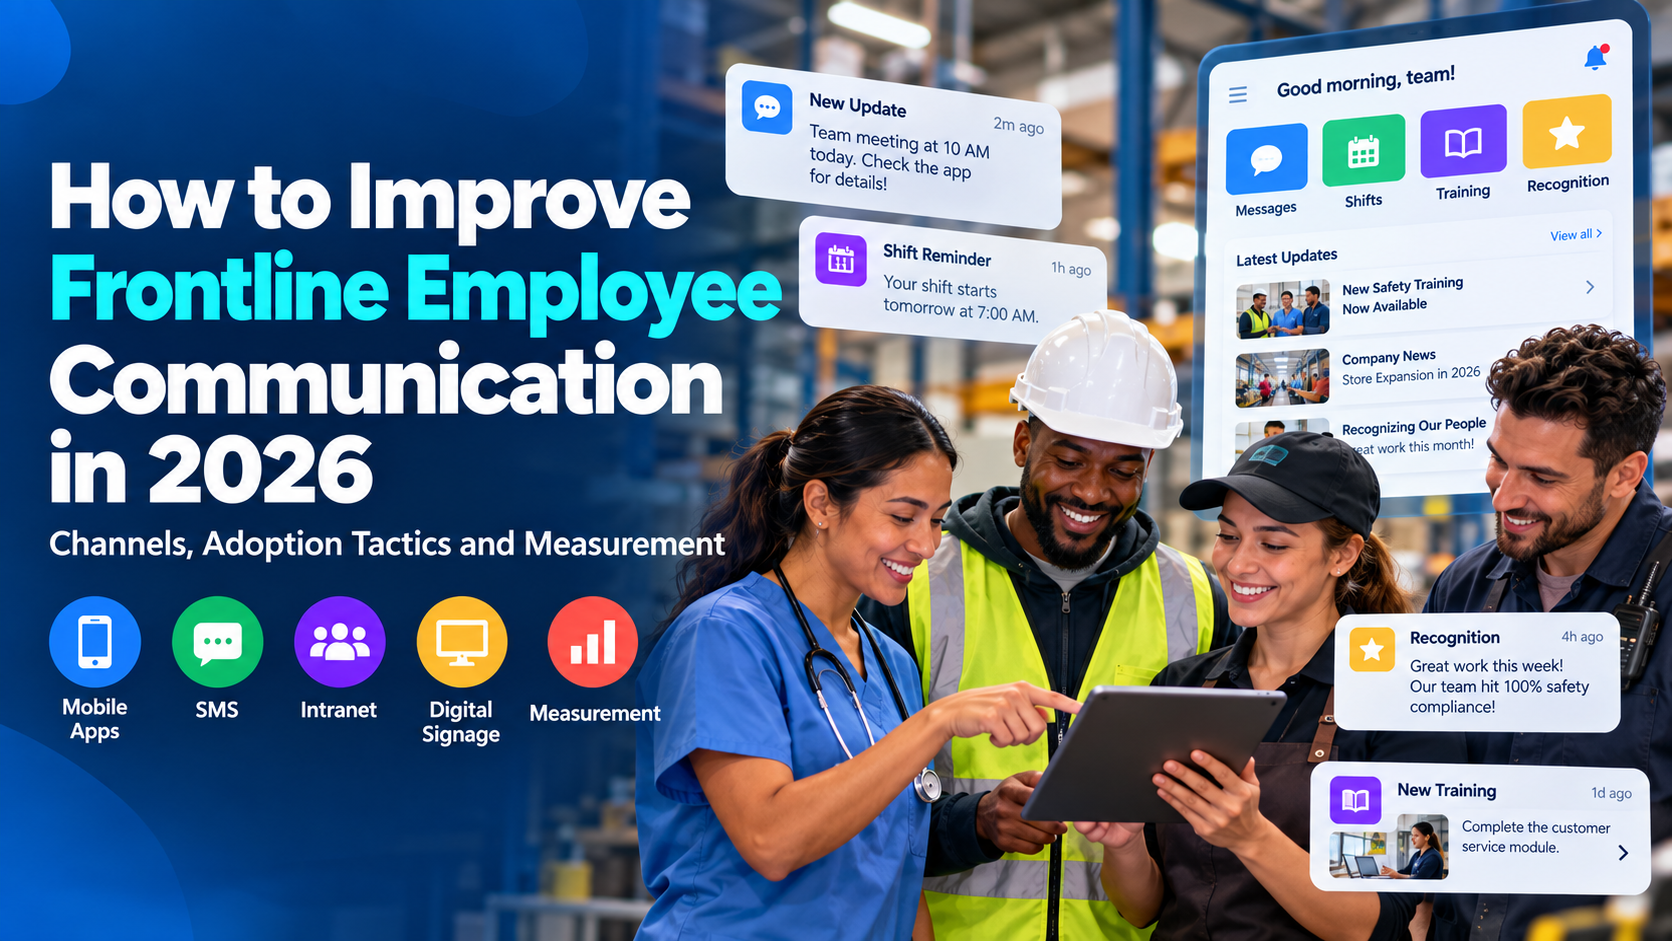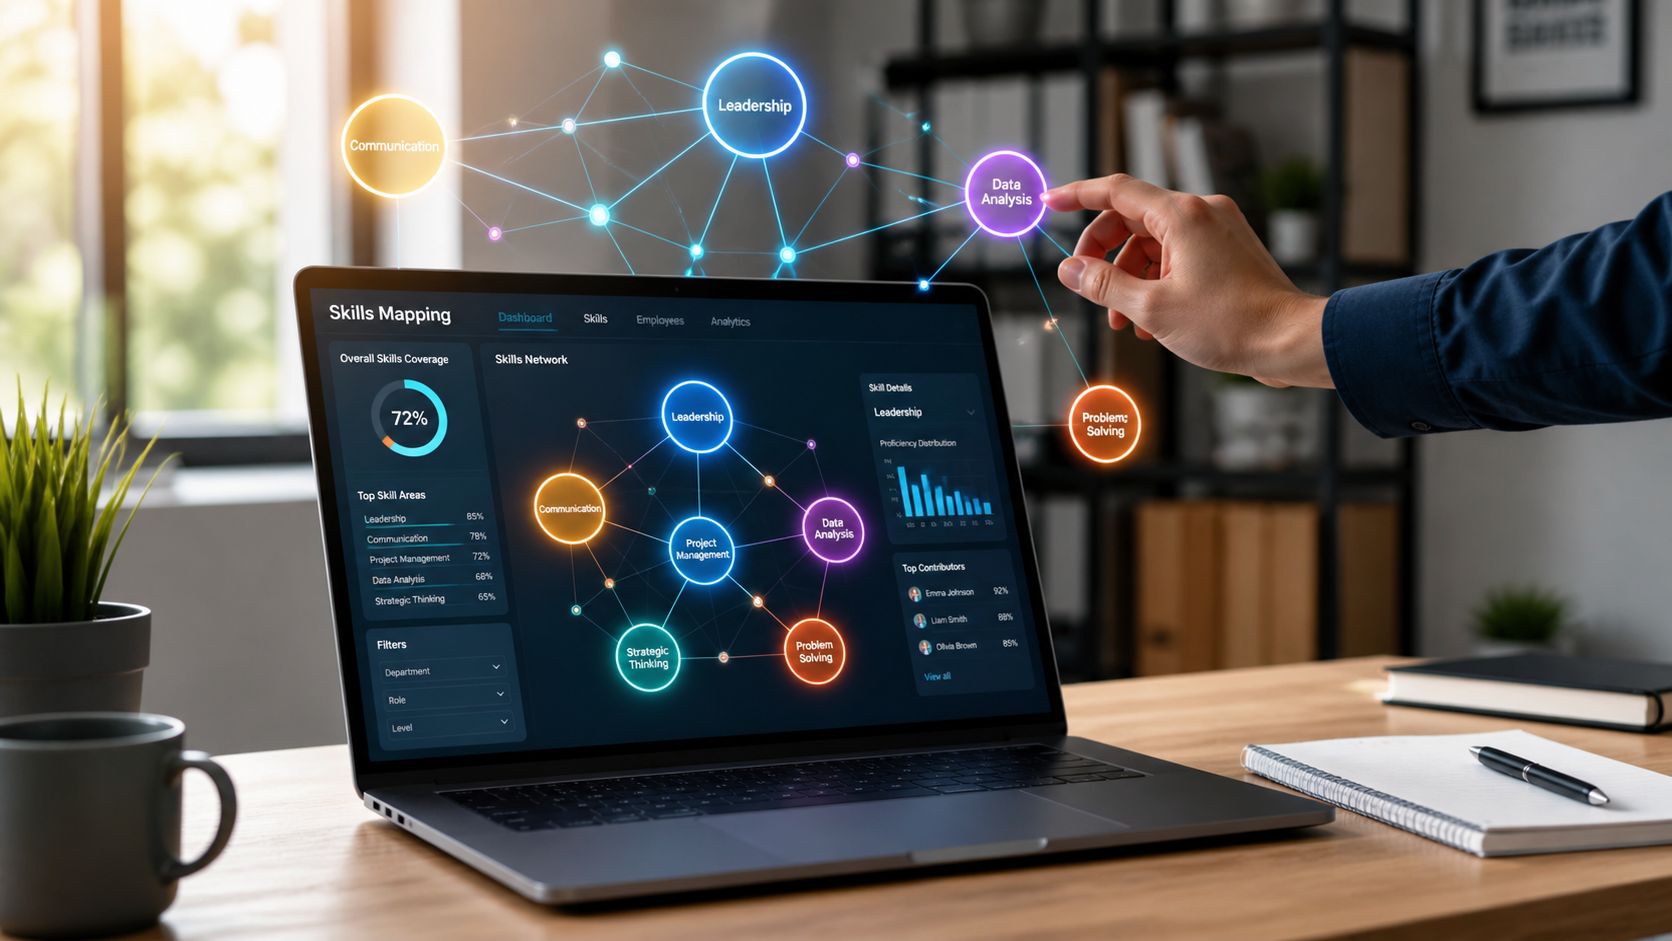
A work graph is only useful if people, tasks, and knowledge stay visible in the same system employees already use, which is why some teams connect it to a unified employee experience platform.
The schedule says the team is fully staffed. The training system shows that every employee completed the required course. The updated procedure is available somewhere on the company intranet.
Yet when the shift begins, the only employee qualified to perform a critical task is assigned elsewhere. A new hire cannot find the procedure. The supervisor spends the first hour moving people around, answering questions, and forwarding links.
Every system appears to be working. The work itself is not.
This is the gap a work graph helps leaders see.
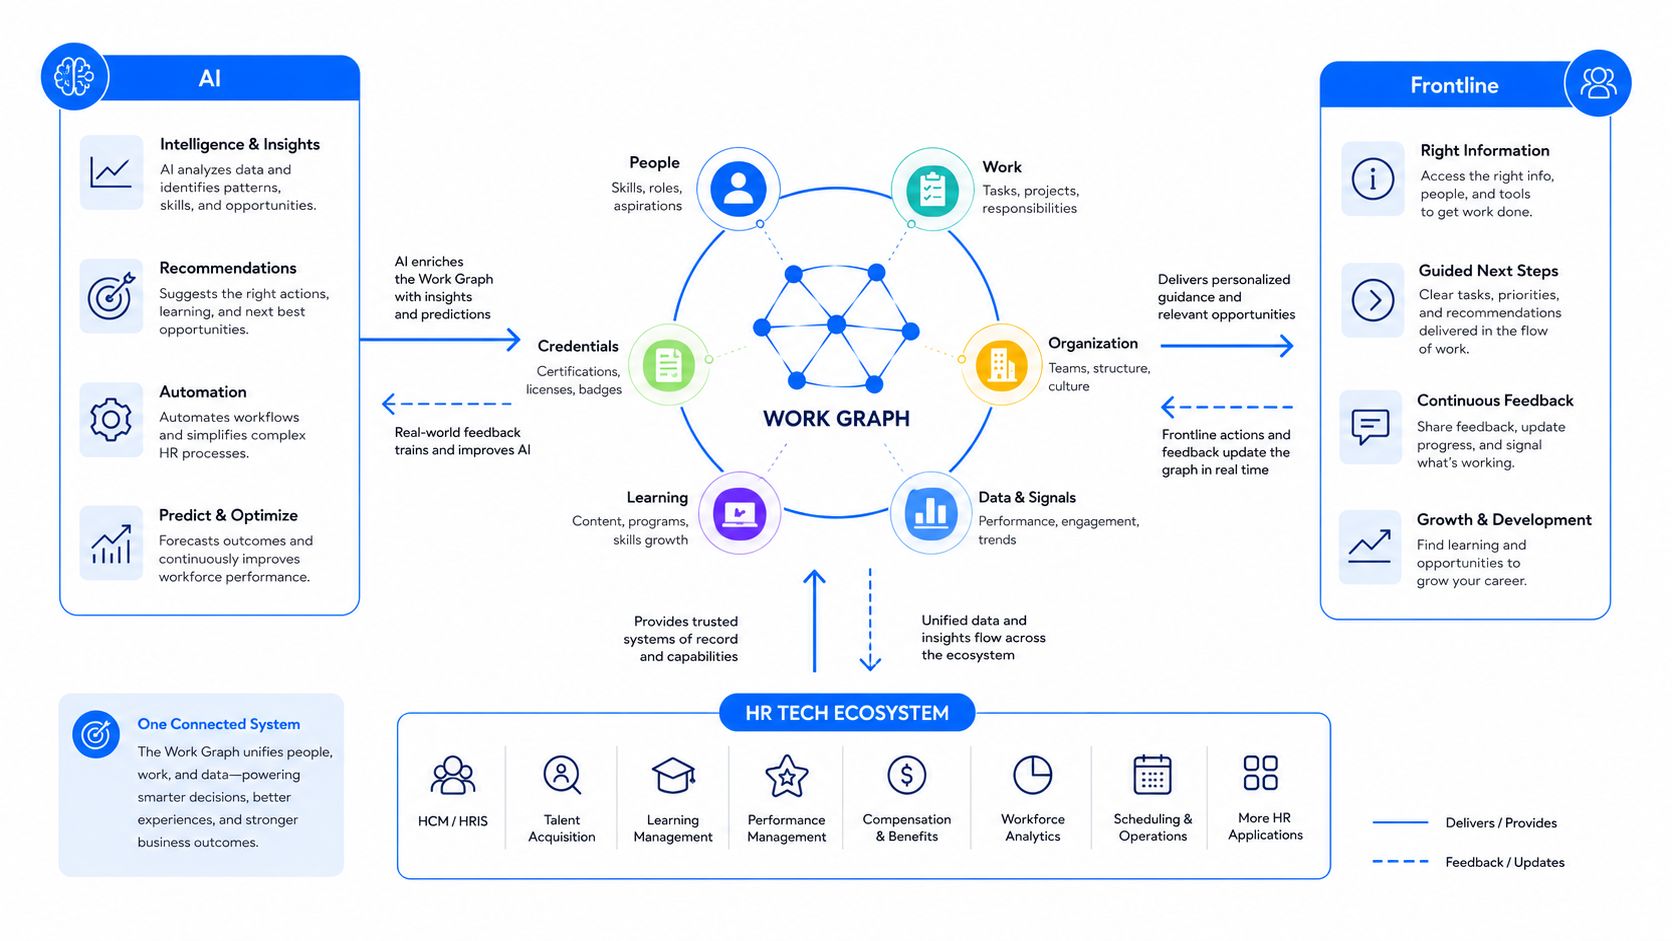
A work graph is a connected map of how work happens across an organization. It shows how people, skills, tasks, knowledge, communication, systems, and outcomes relate to one another.
An organizational chart can tell you who reports to whom. A work graph helps answer a more practical question: What, and who, does it actually take to get the work done?
Key Takeaways
- A work graph reveals relationships that do not appear in an organizational chart.
- It connects workforce information that is often scattered across HR, scheduling, communication, knowledge, and operational systems.
- It can help leaders improve staffing, onboarding, internal mobility, communication, and frontline execution.
- AI becomes more useful when it has access to accurate context about work, not just isolated employee data.
- Organizations should begin with one important workforce question rather than trying to map everything at once.
Why an Organizational Chart Is No Longer Enough
Organizational charts are useful for understanding structure. They show departments, roles, reporting relationships, and levels of authority.
But work rarely follows those lines perfectly.
A project may depend on people from five departments. A frontline supervisor may rely on an experienced employee who has no formal leadership title. A new hire may need information from HR, IT, payroll, training, and a local manager before completing a first assignment.
The org chart shows where these people sit. It does not show how their work connects.
That distinction matters because many workforce problems are not caused by a lack of people or technology. They are caused by missing connections.
Consider a few common situations:
- A manager has enough employees scheduled but not enough people with the required skills.
- HR assigns onboarding content, but the employee cannot find the instructions needed at the point of work.
- An internal communication reaches office employees but misses the night shift.
- A qualified employee is overlooked for an internal role because their capabilities are not visible outside their current department.
- An AI assistant recommends the wrong procedure because it does not know the employee’s location or assignment.
Each problem looks different. Underneath, however, they share the same issue: the organization cannot clearly see the relationships behind the work.
A work graph makes those relationships visible.
Practical rule: if a manager can’t answer a staffing, onboarding, or handoff question without checking three systems and asking two people, the organization already has a work graph problem.
What a Work Graph Connects
Most organizations already have much of the information needed to understand how work gets done. The problem is that the information lives in separate places.
Roles may be stored in the HR system. Skills and certifications may live in a learning platform. Shifts sit in a scheduling tool. Tasks are tracked elsewhere. Procedures are saved in a knowledge base. Important updates travel through email, chat, text messages, meetings, or an employee app.
Individually, each system provides a partial view.
A work graph connects the relevant information so leaders can understand how the parts affect one another.
The connections generally fall into four areas.
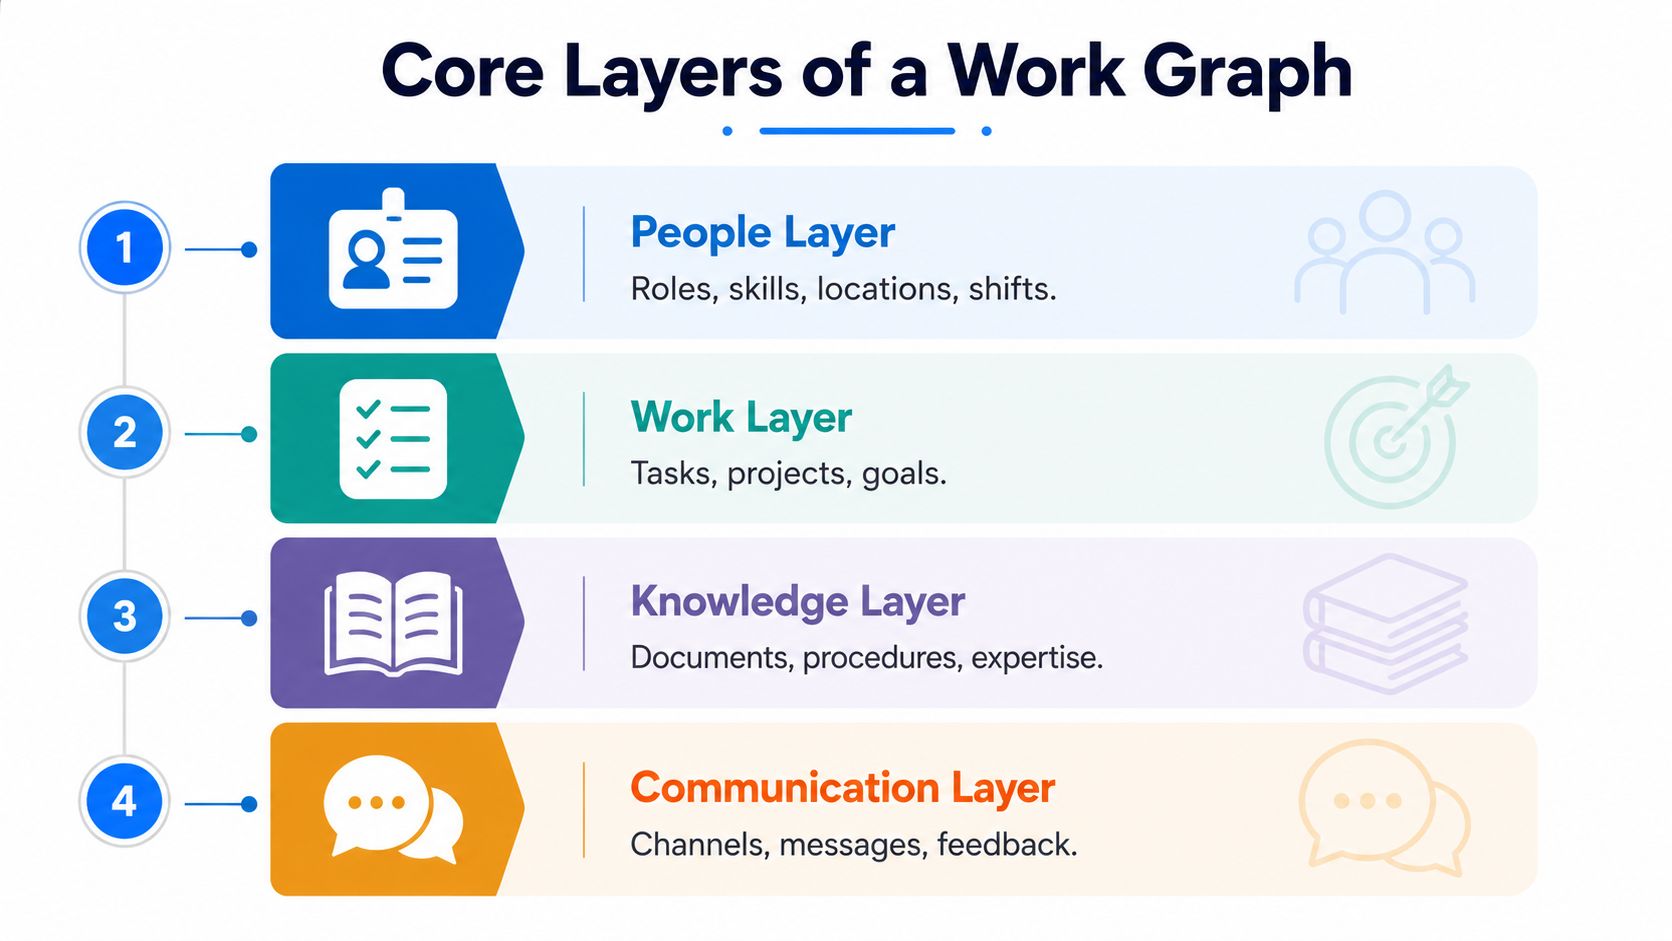
1. People and Skills
This area includes employees, roles, teams, locations, schedules, skills, qualifications, certifications, availability, and experience.
A staffing report may show that 12 employees are available. A connected view can show that only three have the certification required for a particular task, and one of those employees is scheduled at another location.
That difference can prevent a last-minute staffing failure.
The same connections can help leaders identify:
- Employees who can cover a specialized shift
- Teams with critical skill gaps
- Workers who are cross-trained but underused
- People who may be ready for internal mobility
- Locations that depend too heavily on one experienced employee
- New hires who have completed training but still lack practical readiness
The goal is not to create a more detailed employee profile for its own sake. It is to understand whether the organization has the right capabilities available where and when the work requires them.
2. Work and Processes
This area includes tasks, projects, workflows, approvals, deadlines, dependencies, and expected outcomes.
A task rarely exists in isolation. It may require a particular role, skill, procedure, location, tool, approval, or communication.
For example, opening a retail location may depend on:
- A trained employee arriving at the right time
- Access to the building
- Completion of a safety checklist
- Confirmation that equipment is operational
- Awareness of a new promotion or policy
- Escalation instructions if something goes wrong
A task-management system may record whether the checklist was completed. A connected view helps explain the conditions surrounding that completion.
Did the assigned employee have the correct training? Did the team receive the updated procedure? Was the task delayed by an approval? Did another shift leave incomplete work behind?
Those relationships help leaders distinguish between an employee-performance issue and a workflow-design issue.
3. Knowledge and Information
This area includes procedures, policies, training materials, answers, decisions, documents, and informal expertise.
Many organizations do not have a content shortage. They have a relevance and access problem.
A procedure may exist but be difficult to find. A policy may appear in several versions. Training materials may explain a general process without reflecting the equipment or rules at a specific location.
A work graph can connect knowledge to the context in which it is needed.
Instead of showing every search result containing the phrase “equipment shutdown,” a workplace system could identify:
- The employee’s location
- The equipment involved
- The employee’s role and permissions
- The current version of the procedure
- The task being performed
- The appropriate escalation contact
That turns a document library into practical operational support.
It also helps organizations recognize where important knowledge depends on one person. When the same employee is repeatedly asked to explain or rescue a process, the organization has discovered an expertise connection that may not appear in any formal system.
4. Communication and Feedback
This area includes messages, channels, audience targeting, acknowledgements, feedback, surveys, manager conversations, and follow-up actions.
Communication is often measured by activity: how many messages were sent, how many emails were opened, or how many employees visited a page.
Those measures are useful, but they do not tell leaders whether communication supported the work.
A connected view allows more practical questions:
- Did the right employees receive the update before beginning the task?
- Which shift or location missed the message?
- Did employees understand what action was required?
- Did the communication reduce errors or generate more questions?
- Was employee feedback connected to the process that caused the problem?
- Did leaders act on the issue employees identified?
This is especially important for frontline and deskless teams. An announcement can achieve a high overall reach rate while still missing the small group responsible for carrying out the change.
The purpose of the communication is not simply to be seen. It is to help the right people act.
A strong work graph doesn’t start with perfect data. It starts with one clear question, then connects only the nodes needed to answer it.
Questions a Work Graph Helps Leaders Answer
The value of the model becomes clearer when it is applied to real decisions.
Do we have the right people for the work ahead?
Traditional workforce planning often begins with headcount. A work graph adds skills, certifications, schedules, locations, and task requirements.
That makes it easier to determine whether an organization has actual capability, not simply enough people on paper.
A hospital planning a new unit could identify which employees already have the required credentials, who needs additional training, and which shifts may lack experienced coverage.
A logistics company could see which workers can operate specific equipment and whether those skills are concentrated at one site.
A growing business could identify where hiring is necessary and where reskilling or internal mobility may solve the problem faster.
Why are new hires taking so long to become productive?
Onboarding is often measured through completed forms, assigned training, and system access.
But completion does not always mean readiness.
A new employee may have finished orientation but still lack:
- The correct local procedure
- Access to a required application
- A clear first assignment
- Knowledge of who can answer questions
- Information that was shared before their start date
- Feedback on whether the work was completed correctly
A work graph can reveal the path between the new hire, the role, the required skills, the assigned tasks, the supporting knowledge, and the responsible manager.
That helps leaders find the actual source of delay instead of adding another generic training module.
Where are handoffs breaking down?
Handoffs are common sources of invisible friction.
One shift assumes the next team received an update. One department completes its portion of a request but does not know another approval is required. A manager believes HR owns the next step, while HR believes the manager does.
A work graph can expose these dependencies.
It can show where a task changes hands, what information should move with it, who owns the next action, and which system records completion.
This helps leaders redesign the handoff rather than reminding employees to “communicate better.”
Who may be ready for another role?
Internal mobility is difficult when leaders rely primarily on job titles and manager nominations.
Employees often develop useful capabilities through projects, temporary assignments, peer support, previous experience, or informal responsibilities. Those connections may not appear in a standard employee record.
A connected view can help identify adjacent skills and relevant experience.
For example, an employee may not have held a formal team-lead role but may regularly train new hires, resolve difficult customer issues, and coordinate shift handoffs. Those relationships may indicate readiness that a job-title search would miss.
The graph should inform not automate the decision. Managers and employees still need to discuss interest, performance, and development.
Why did an important update fail?
When execution is inconsistent, leaders often assume employees ignored the message.
A connected view can reveal other explanations:
- The update went to the wrong channel.
- The affected employees were not included in the audience.
- The message arrived after the shift started.
- The instructions conflicted with an older document.
- Employees understood the change but lacked the equipment or access needed to act.
- Managers received the information but frontline employees did not.
This turns communication measurement into an operational tool rather than a simple engagement report.
Useful test: if the same person keeps being asked to translate, explain, or rescue a process, the graph is already telling you where expertise lives.
That’s also where employee listening fits. A work graph can help leaders connect what people say in surveys or manager check-ins to what they experience in work systems. Employee listening strategy context
How a Work Graph Makes AI More Useful
AI can answer a question quickly and still provide the wrong answer.
The problem is often not the language model itself. It is the lack of workplace context.
Imagine an employee asking an AI assistant, “How do I close this location tonight?”
A generic system may return a standard closing checklist. A context-aware system would need to know:
- Which location the employee is working at
- The employee’s role and permissions
- Which type of closing shift is underway
- Whether a local exception is active
- Which version of the checklist is current
- Whether a task has already been completed
- Who should be contacted if there is a problem
Those connections are what make an answer useful at the point of work.
The same principle applies to AI recommendations.
An AI tool suggesting an employee for an assignment should not rely only on a job title. It may need to consider skills, certification status, location, availability, workload, experience, and employee interest.
A system identifying an onboarding risk should not treat a late course completion as the whole story. It should examine whether the employee received the assignment, had system access, found the relevant instructions, and received manager support.
A work graph can provide this surrounding context.
However, organizations should not assume that more connected data automatically produces better decisions. Information must be accurate, relevant, current, and governed responsibly.
AI should help employees and managers navigate work, not turn every workplace interaction into a data-collection exercise.
Why Frontline Organizations May Benefit Most
Frontline work creates many of the conditions in which hidden connections matter:
- Shifts change frequently.
- Work is location-dependent.
- Skills and certifications affect staffing.
- Employees may not have regular desktop access.
- Information must arrive at the right time.
- Small handoff failures can affect safety, service, or production.
- Managers often compensate for disconnected systems.
Consider a manufacturing supervisor who receives an updated safety procedure by email. The document is also uploaded to the intranet, but the night-shift employees do not regularly use either channel.
The supervisor explains the change verbally. Most employees understand it, but two workers begin their tasks before the huddle. One follows the old process.
A communication report may show that the email was delivered. A learning report may show that everyone previously completed the safety course. A staffing report may show that the shift was fully covered.
Only a connected view reveals that the updated procedure did not reach every person before the relevant task began.
This is where the work graph becomes practical. It helps connect communication reach with shifts, tasks, roles, knowledge, and outcomes.
A Work Graph Is Not Necessarily Another Platform
The idea can sound like a proposal to purchase another large system.
It does not have to be.
A work graph is created by connecting the workforce information needed to understand a decision or process. That may involve integrations, a shared data layer, consistent identifiers, improved reporting, or better coordination among existing platforms.
Most organizations already have relevant information across systems such as:
- Human resources
- Workforce management and scheduling
- Learning and skills management
- Internal communications
- Knowledge management
- Task or project management
- Employee listening
- Service and support systems
The first challenge is not collecting every possible data point. It is deciding which relationships are necessary to answer an important question.
An organization trying to improve frontline onboarding may begin by connecting only:
- Role and location
- Required skills
- Assigned training
- First tasks
- Relevant procedures
- Communication delivery
- Manager follow-up
That focused view may be more useful than a massive data project with no immediate operational purpose.
Common Misconceptions
“It is just a more advanced organizational chart.”
An organizational chart focuses on formal structure. A work graph focuses on the relationships required to complete work.
The two can complement each other, but they answer different questions.
“We need perfect data before we start.”
Waiting for perfect data can prevent useful progress.
The organization needs enough reliable information to support one defined use case. Data quality should improve as the model expands, but perfection is not a prerequisite for a focused pilot.
“The graph should map everything.”
Trying to map every person, task, document, message, system, and outcome at once can create a costly project with little practical value.
Begin with one question leaders need to answer. Connect only what is needed to answer it well.
“This belongs to IT.”
Technology teams may manage integrations and architecture, but they cannot define how work happens on their own.
HR understands roles and employee processes. Operations understands execution. Internal communication understands audience and reach. Managers and employees understand the workarounds that formal documentation often misses.
The model must be built with the people who perform and support the work.
“It can replace managerial judgment.”
A work graph can show relationships, identify patterns, and provide context. It cannot fully understand ambition, trust, team dynamics, personal circumstances, or the nuances of every workplace decision.
It should improve managerial judgment, not replace it.
Risks and Governance Questions
Connecting workforce information can create meaningful value. It can also create legitimate concerns about privacy, surveillance, bias, and over-automation.
Leaders should define clear boundaries before expanding the model.
Important questions include:
- What business or employee problem are we solving?
- Which data is truly necessary?
- Who can view the information?
- How long will it be retained?
- Can employees review or correct relevant information?
- How are inferred skills or relationships validated?
- Can leaders explain why a recommendation was produced?
- Which decisions must remain with people?
- Could the information be misinterpreted or used outside its original purpose?
- How will employees participate in the design?
The goal should be to remove friction and improve support – not to create a hidden scoring system for employees.
A useful work graph helps people understand and navigate the organization. A poorly governed one may reduce complex individuals to incomplete data points.
A Practical 90-Day Plan
Organizations can begin without launching a company-wide transformation.
Days 1–30: Choose one workforce question
Start with a question that matters to employees and the business.
Examples include:
Why are frontline new hires taking too long to become productive?
Do we have the skills needed to staff a new location?
Why are shift handoffs producing repeated errors?
Which employees may be ready for a hard-to-fill internal role?
Why are important operational updates not reaching the right teams?
Then map how the organization currently answers the question.
Identify:
- The people involved
- The systems they check
- The data they use
- The manual steps they perform
- The information they cannot easily access
- The decisions that depend on manager memory
- The point where the process most often breaks
The goal is not to design the graph yet. It is to understand the real workflow.
Days 31–60: Connect the minimum useful information
Select only the relationships needed for the chosen use case.
For an onboarding pilot, that might include:
- Employee
- Role
- Location
- Required skill
- Training status
- First assigned task
- Supporting procedure
- Manager
- Communication delivery
Test whether those connections help leaders identify blocked employees earlier.
Do not focus only on the interface. Check whether the underlying information is accurate, whether responsibilities are clear, and whether the resulting view helps someone make a better decision.
Days 61–90: Pilot and measure
Use the connected view with one real team or workforce group.
Measure an outcome employees and managers can recognize, such as:
- Time to first independent task
- Number of onboarding support requests
- Shift coverage for required skills
- Time spent resolving handoff errors
- Ability to find the correct procedure
- Reach of operational communications
- Number of qualified internal candidates identified
- Manager time spent gathering information
Collect feedback from the people using the process. Ask what the model still misses and where the data creates a misleading picture.
Then decide whether to improve the pilot, expand it, or choose a different use case.
What Success Looks Like
A successful work graph does not need to look impressive.
Its value appears in everyday decisions.
A manager can see that a shift has enough qualified coverage before publishing the schedule. A new employee receives the right procedure when the first task is assigned. An internal communication reaches the employees responsible for acting on it. A recruiter finds a strong internal candidate whose potential was previously hidden.
Employees spend less time searching, repeating information, and finding someone who knows how the process really works.
Managers spend less time connecting systems manually.
Leaders gain a more accurate view of organizational capability – not because they collected more data, but because they connected the right information around the work.
Final Thoughts
Organizations are usually structured one way and operated another.
The formal structure appears in job descriptions, reporting lines, departments, and systems of record. The operating reality lives in handoffs, informal expertise, workarounds, communication channels, local processes, and the people managers rely on when something goes wrong.
A work graph brings those hidden relationships into view.
It gives HR and operations leaders a way to move beyond isolated reports and examine the organization as employees experience it: a connected system of people, work, information, and decisions.
The better question is not simply, “Do we have the right people and systems?”
It is, “Are they connected in a way that helps people get the work done?”
That perspective is central to Turn On Work’s approach to workforce experience. Engagement, communication, technology, AI, frontline enablement, and operations cannot be improved effectively when they are treated as separate concerns.
Work Graph FAQs
What is a work graph in simple terms?
A work graph is a connected map of the people, skills, tasks, knowledge, communication, systems, and outcomes involved in getting work done.
How is a work graph different from an organizational chart?
An organizational chart shows formal reporting relationships. A work graph shows how people, information, and systems connect across the actual flow of work.
Is a work graph a software product?
Not necessarily. It is a model for connecting relevant workforce information. An organization may support it through existing platforms, integrations, analytics, or a dedicated technology layer.
What data is needed to get started?
Begin with only the information required to answer one important workforce question. This could include roles, skills, schedules, tasks, procedures, communication records, or outcomes.
Who should be involved?
HR, operations, internal communications, IT, managers, and employees may all contribute. The right group depends on the workflow being examined.
Can a work graph support AI?
Yes. It can give AI tools more useful context about roles, skills, tasks, locations, knowledge, and communication. The quality of the result still depends on accurate data, appropriate governance, and human oversight.
Which organizations benefit most?
The model can help any organization with complex or distributed work. It may be especially valuable for frontline, shift-based, multi-location, hybrid, or rapidly changing workforces.